Like most promises made before an election, the promise of an economic recovery is beginning to look like a false promise.
Last fall, the housing market was showing signs of recovery and the unemployment rate was dropping. The stock market since then has been propelled upward by the artificial stimulus of quantitative easing.
Now, though, economic indicators are less promising. The Conference Board reported today that, after three months of gains, its index of leading indicators dipped 0.1% to 94.7 in March.
The index, which anticipates economic conditions three to six months out, was buoyed by higher stock prices and a growing spread between long-term and short-term interest rates, but those factors were more than offset by declines in consumer confidence, housing permits and new orders for manufactured goods.
The U.S. has plenty of company, though, as the International Monetary Fund has lowered its projections for global economic growth in many countries, not just the U.S. The IMF this week predicted 1.9% growth for the U.S. in 2013, down 0.2% from the IMF’s January prediction. Some countries, such as France, Italy and the UK, took an even bigger hit, but the IMF prediction for Japan rose 0.4% to 1.6% and for Germany, it rose 0.1% to 0.6%.
In other words, it looks like more of the same, at least for the rest of the year – slow growth and slow progress toward full economic recovery.
Divergence Ending?
The U.S. stock market’s positive performance has a bright spot in a dull economy, as the U.S. economy recently appeared to be diverging from economies in the rest of the world. Stock markets in other countries have not been setting records and most are nowhere close to their 2007 highs.
The only markets posting positive returns recently have been the U.S. and Japanese markets. As in the U.S., the central bank in Japan is actively intervening. Markets in Europe and the BRIC countries (Brazil, Russia, India and China) have been lagging.
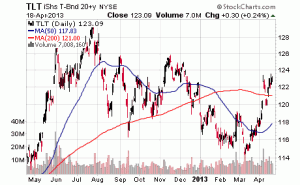
Many were predicting that a rotation out of bonds and into the stock market would continue to push the market higher. Instead, as the first chart shows, bond yields continue to move lower, dropping from 2% to 1.68% for 20+ U.S. Treasury bonds.
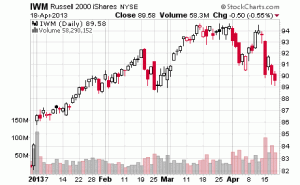
In addition, the second chart shows that the Russell 2000 could be setting up to drop another leg lower. If there’s a close below the February 2013 low, we’re likely to see the 2013 gain erased.
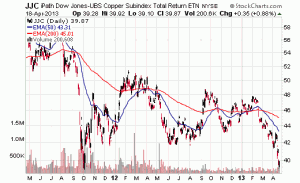
And finally, the third chart shows that copper prices are back to their 2011 low. Copper prices are a leading indicator of what’s happening to the economy. If the economy were in a growth phase, copper prices would be climbing, not falling.
Some believe America is the least ugly place to invest and that, as a result, money will continue to flow to U.S. markets. But if we’re expecting money inflows to keep the market rising (scary thought), it’s worth looking at where U.S. multinationals make their profits. If the rest of the world is in a recession, how will their profits be affected?
Artificially induced market growth can only go so far.


